UPDATE: Alex Hall pointed out that IPython can display the values of variables in the highlighted sections using %xmode verbose. He also suggested a different highlighting strategy when the problematic code spans multiple lines. I go into more details about these two issues in a future blog post.
======
I'm writing this blog post in the hope that some people will be encouraged to test friendly/friendly-traceback with IPython/Jupyter and make suggestions as to how it could be even more useful.
However, before you read any further...
Important clarification: IPython is a professionally developed program which is thoroughly tested, and is an essential tool for thousands of Python programmers. By contrast, friendly/friendly-traceback is mostly done by a hobbyist (myself) and is not nearly as widely used nor as reliable as IPython. Any comparison I make below should be taken in stride. Still, I can't help but draw your attention to this recent tweet from Matthias Bussonnier, the IPython project leader:

I don't believe that friendly/friendly-traceback is mature and stable enough to become part of IPython's distribution. However, it is because of this endorsement that I decided to see what I could do to improve friendly/friendly-traceback's integration with IPython.
IPython news
The recent release of IPython included many traceback improvements. One of these changes, shown with the screen capture below:

is something that I am happy to have implemented many months ago as mentioned in this blog post. I have no reason to believe that my idea was the impetus for this change in IPython's formatting of tracebacks. Still, I think it validates my initial idea.
However, there have been other changes introduced in this latest IPython release, such as using colour instead of ^^ to highlight the location of the code causing a traceback is something that I had done only for IDLE but not for other environments such as IPython/Jupyter. So, I felt that I had to catch up with what IPython has implemented and, if possible, do even better. Of course, I must recognize that this work is greatly facilitated since I use Alex Hall's excellent stack_data (as well as some other of his packages on which stack_data depends) in friendly-traceback: stack_data is now used by IPython to generate these tracebacks. So, in principle, there is no reason why I shouldn't be able to implement similar features in friendly/friendly-traceback.
Again, I must note that the way I use stack_data is a bit hackish, and definitely not as elegant as it is used within IPython.
Enough of a preamble, time to provide some actual examples.
First example

Here is the result:

We can see not only the lines of code that caused the traceback, but actually the specific parts of each line that caused a problem. Notice how the display jumps from line 6 to line 8: this is because line 7 is an empty line. Such empty lines are removed to reduce the vertical space require for the display.
I could replicate this example using the friendly console but, instead, I will use the specific IPython integration to see what else we could do at this point.

We see a traceback that is somewhat similar to a standard CPython traceback, but with an additional hint at the end which gives us an additional clue as to what the cause of the error might be. Friendly/friendly-traceback can give more information about what() a particular exception means in general, why() it might have happened in this particular case and where() it occurred:

By design, the information provided by where() only focus on the beginning and the end of the traceback, so as to not overwhelm beginners with often irrelevant steps in between. However, notice that in addition to the highlighted parts (new feature!), we also see the values of some objects from these highlighted regions.
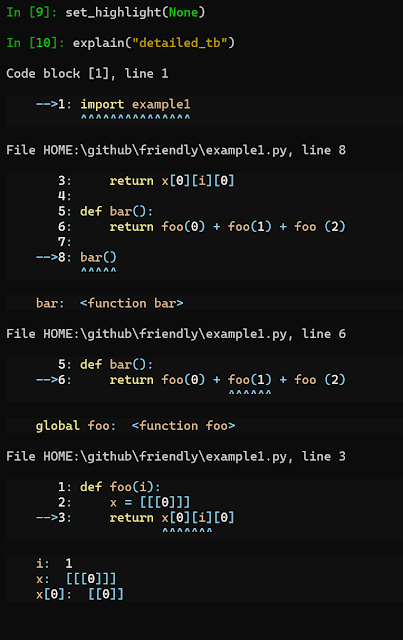
Until recently, this was all the information that one could get. However, it is now possible to get more details, in a way similar to that provided by IPython, but with the addition of the values of various objects. (Note that the syntax shown below to obtain this information is subject to change; it is just a proof of concept.)

Other than the different colour chosen for highlighting (both IPython and this example are done in a Windows Terminal), I also chose to ensure that one line per frame was highlighted, such as the line "import example1". Do you think this is a good choice, or should I do like IPython?
If the highlighting is not adequate, it can be changed by using either named colours (converted to lowercase with spaces removed) or hexadecimal values; the name of the function and its arguments are subject to change:

Any such change is written to a settings file so that it is remembered for future sessions. Those that prefer traditional Python's notation with ^^ can do so by using None as an argument:

Example 2

Instead of highlighting each line from the beginning, I chose to not highlight the indentation; is this a better choice?

Jupyter notebook
When IPython is used in a Jupyter notebook (or lab), I chose yet again a different way to present the result. First, let's have a look at a simple example using the Jupyter default.

In this example, only two frames are highlighted. Let's see the result, using friendly.


We already have seen the output of what() and why() before; this time let's just click on where():

Since we only had two frames in the traceback, where() gives us all the relevant information.
What happens if we have more than two frames in the traceback? First, let's give an example with the Jupyter default.

What happens if we use friendly in this case? Below I show the result after clicking "more"

An additional button has appeared. Note that this is something new that I just did earlier today (before writing this blog post). It is quite possible that there might be bugs if you try it.

Conclusion
These new features are simple proofs of concept that have not been thoroughly tested. If you read this far, and hopefully tried it on your own, I would really appreciate getting your feedback regarding the choices I made and any improvement you might be able to suggest.
No comments:
Post a Comment