The mathematical definition of the derivative of a function f(x) at point x is to take a limit as "h" goes to zero of the following expression:
( f(x+h) - f(x) ) / h
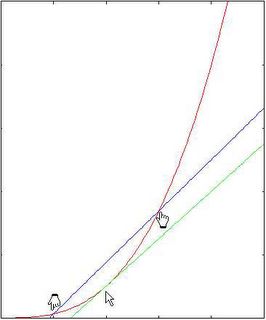
An example is given below: the red curve is the function f(x) and the green curve is the tangent line at x (with same slope as the derivative). The blue curve is a line going through x whose slope equals that of the above formula with a non-zero value of h.

As you can see, the slopes of the two straight lines are quite different. A better way of numerically computing the derivative for the same value of "h" is by taking a symmetrical interval around x as follows:
( f(x + h/2) - f(x - h/2) ) / h
This is illustrated in the next picture. As you can see, the two straight lines have much more similar slopes - hence, the value computed for the derivative is going to be more accurate.

The corresponding python code is as follows:
def derivative(f):
...."""
....Computes the numerical derivative of a function.
...."""
....def df(x, h=0.1e-5):
........return ( f(x+h/2) - f(x-h/2) )/h
....return df
And we use it as follows:
# sample function
def g(x): return x*x*x
# first derivative
dg = derivative(g)
# second derivative
d2g = derivative(dg) # == derivative(derivative(g))
# printing the value computed at a given point:
print dg(3)
print dg(3, 0.001)
print dg(3, 1e-10) # smaller h is not always more precise